PyTorch’s profiler can produce pt.trace.json traces. By default, you can visualize these traces in Tensorboard.
However, Tensorboard doesn’t work if you just have a trace file without any other Tensorboard logs. This can happen if you use PyTorch Lightning’s wrapper, or if you stored the profiling trace somewhere else such as a remote machine.
In this case, you can open the pt.trace.json file directly in Chromium or a Chrome-based browser. Just open chrome://tracing, and drag-and-drop the JSON file. Then, you can use the GUI to visualize different parts of the trace:
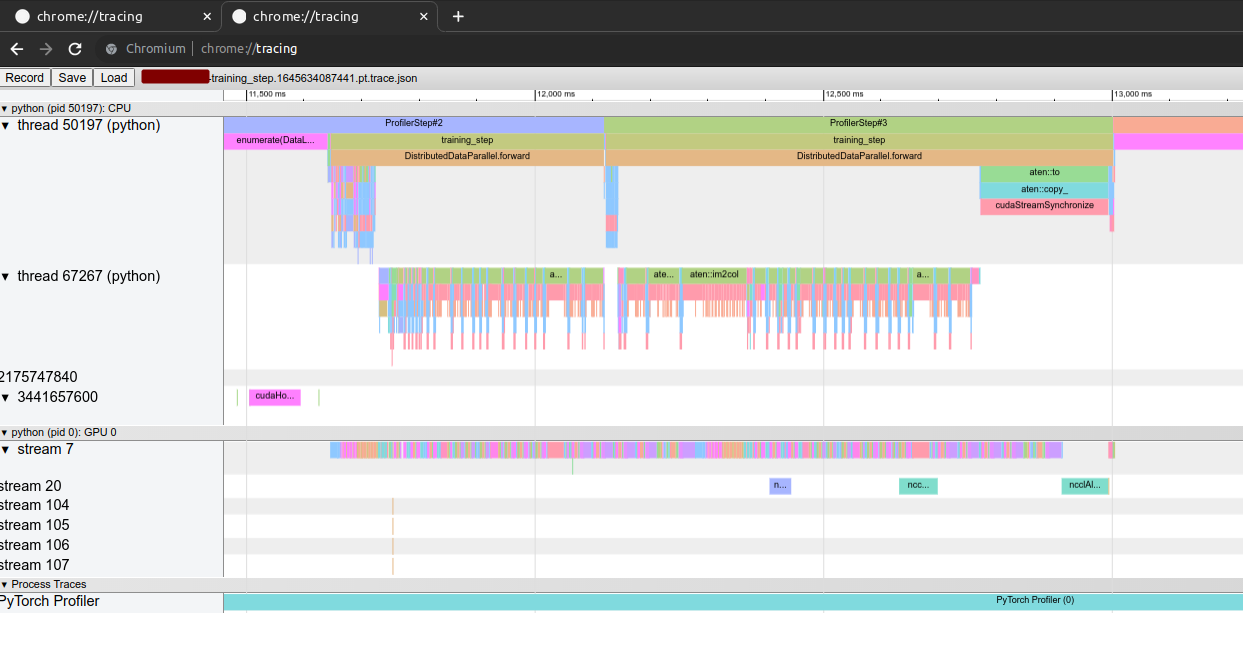
PyTorch profiler trace in Chromium.
One caveat: in my experience, Chromium doesn’t handle large trace files (above ~200Mb). So if you get a blank page, try with a smaller file.